Build a chart and a map from a single model with Public API
Last updated
In this tutorial, you deliver data using the features of Re:Earth CMS, a headless CMS. What is Re:Earth CMS explains how a headless CMS works, so you may want to read it first.
You’ll create a model in Re:Earth CMS and use it from two delivery destinations through Public API, in these steps.
- Decide the structure of the data and register it in Re:Earth CMS.
- Deliver the registered data through Public API.
- Use the same data in a spreadsheet chart (Microsoft Excel) and in a Re:Earth Visualizer map.
The data you’ll put into the model is a set of tourist facilities prepared for this tutorial. The visitor numbers aren’t real figures; they’re values for this tutorial.
Every step is a screen operation, so you won’t need a code editor.
Prerequisites
Section titled “Prerequisites”- A Re:Earth account
- Microsoft Excel. You’ll use it as your spreadsheet software.
If you don’t have Excel, you can use Google Sheets instead. The import steps are written in the main text. The chart steps are written for the Excel screen, so read them as their Google Sheets equivalents.
Create a project
Section titled “Create a project”To hold the tourist facility data, create one project in Re:Earth CMS.
- On the workspace home of Re:Earth CMS, click New Project.
- In Project name, enter
Tourist Spots. Because it’s alphanumeric,tourist-spotsis filled into Project alias automatically. - Under Project visibility, choose Public. Depending on your plan, you can also choose Private.
- Project description is optional. Leave it empty and move on.
- Under Project license, choose Creative Commons Attribution 4.0 International.
- Click OK.
The project you created appears in the project list on the workspace home.
The Public you chose in step 3 is the setting that publishes the project as open data. For details, see Visibility in Project.
Creative Commons Attribution 4.0 International, which you chose in step 5, states the conditions under which others may use and share the data you publish. It allows modification, redistribution, and commercial use, on condition that the creator and the copyright are credited, that the license is referenced, and that any changes are indicated. When you deliver your own data, choose a license that matches your terms of use.
Create a model for the facilities
Section titled “Create a model for the facilities”Inside the project, create a model that holds the tourist facility data.
- In the project list on the workspace home, open
Tourist Spots. - On the Models screen, click New Model.
- In Model name, enter
Facility.facilityis filled into Model key automatically. - Leave Model description empty and click OK.
The Schema screen of the Facility model opens. On this screen you set the schema that defines the values of the items that go into the model.
Add fields
Section titled “Add fields”Before you register any actual data, you decide what to record about a facility as fields. If the words field and schema are unfamiliar, or if it isn’t clear why the fields come before the data, we recommend reading Decide the model’s structure first first.
Add the following four fields, from the top down.
| Display name | Field Key | Field |
|---|---|---|
Name | name | Text |
Address | address | Text |
Location | location | Geometry Editor |
Visitors | visitors | Int |
Add the first one, Name.
- On the Fields tab, open Add Field and click Text.
- On the Settings tab, enter
Namein Display name.nameis filled into Field Key automatically. - This value is used as the item’s heading, so turn on Use as title.
- On the Validation tab, turn on Make field required.
- Click OK.
Add the second one, Address.
- Open Add Field and click Text.
- In Display name, enter
Address. - On the Validation tab, turn on Make field required.
- Click OK.
Add the third one, Location.
- Open Add Field and click Geometry Editor.
- In Display name, enter
Location. - Under Supported type, choose Point.
- On the Validation tab, turn on Make field required.
- Click OK.
Add the fourth one, Visitors.
- Open Add Field and click Int.
- In Display name, enter
Visitors. - On the Validation tab, turn on Make field required.
- Click OK.
The four fields you added are listed on the Fields tab. A field you made required carries *, and Name, which you set as the title, carries Title.
The schema of the Facility model is now in place. You’ll register items along the fields this schema defines.
Create items
Section titled “Create items”Along the fields the schema defines, register the facilities one at a time as items. You’ll register these four.
Name | Address | Location | Visitors |
|---|---|---|---|
| The National Museum of Western Art | 7-7 Uenokoen, Taito City, Tokyo | Entered from the map on screen | 100000 |
| Sensoji Temple | 2-3-1 Asakusa, Taito City, Tokyo | Entered from the map on screen | 300000 |
| Ueno Zoological Gardens | 9-83 Uenokoen, Taito City, Tokyo | Entered from the map on screen | 200000 |
| National Museum of Nature and Science | 7-20 Uenokoen, Taito City, Tokyo | Entered from the map on screen | 150000 |
Text, which you chose for Name and Address, is a field you type freely into. Geometry Editor, which you chose for Location, is a field you fill by placing a point on the map on screen. Int, which you chose for Visitors, is a field for a number without decimals.
Register the first one.
- Under Models on Content, choose the model name
Facility. - Click New Item.
- Enter a value in each field.
- In
Name, enterThe National Museum of Western Art. - In
Address, enter7-7 Uenokoen, Taito City, Tokyo. - In the search bar on the
Locationmap, enterThe National Museum of Western Artand search. The map moves to the area around that facility. - Click the map pin icon at the top right of the map.
- Click the position of the facility on the map. A point is placed, and the coordinates go into
Location. - In
Visitors, enter100000.
- In
- Click Save.
Once you save, the item’s status becomes Draft.
Register the remaining three the same way. The fields are fixed within the model, so you register the second item onward by entering values in the same four fields.
The data you’ll deliver is now registered.
Re:Earth CMS handles the data and its delivery, and nothing beyond that. How the delivered data is handled is decided at the destination, and this tutorial uses two of them: spreadsheet software and Re:Earth Visualizer. In the next step, you’ll set up the delivery in Re:Earth CMS.
Publish items
Section titled “Publish items”Re:Earth CMS delivers data through an API. This tutorial uses Public API, which reads published data without authentication. For details, see Public API Settings.
Public API delivers only items whose status is Published. Of the four items you registered, publish three.
- In the list on the Content screen, select the checkboxes on the rows for
The National Museum of Western Art,Sensoji Temple, andUeno Zoological Gardens. - Click Publish.
- In the Publish items confirmation, click Yes.
The status of the three items becomes Published. National Museum of Nature and Science stays Draft. What gets delivered from here on is the three you just published.
Get the endpoint
Section titled “Get the endpoint”Public API holds one URL per model it delivers. This URL is called the endpoint. A destination retrieves that model’s items from the endpoint.
Get the endpoint of the Facility model.
- In the left menu, open Public API.
- Open the Reading tab.
- Copy the URL under Endpoint on the row of the model name
Facility.
In a workspace on a paid plan, if the project’s visibility is Private, turn on Enable on the Facility row and click Save Changes before step 3.
Public API can deliver items in JSON, CSV, or GeoJSON.
In the next steps, you’ll use Excel and Re:Earth Visualizer to work through delivering and reusing the model you created in Re:Earth CMS.
Display the data in a spreadsheet
Section titled “Display the data in a spreadsheet”Import the endpoint URL you got from Re:Earth CMS into Excel, and display the data being delivered.
- In Excel, create a blank workbook.
- On the Data tab, click Get Data, then From Other Sources, then From Web.
- In URL, paste the URL you copied in step 3 of “Get the endpoint”.
- At the end of the URL you pasted, type
.csv. - Click OK.
- Access Web content appears. Confirm that the connection is Anonymous, leave the level as it is, and click Connect.
- Click Load.
To work in Google Sheets, do the following instead of steps 1 to 7.
- In Google Sheets, create a blank spreadsheet.
- In cell
A1, enter=IMPORTDATA(""). - Between the
"and the", paste the URL you copied in step 3 of “Get the endpoint”. - At the end of the URL you pasted, type
.csv. - Press the Enter key.
The data being delivered appears as a table on a new sheet. Because you added .csv to the end of the endpoint URL in step 4, Re:Earth CMS delivers it to Excel in CSV.
Row 1 of the table holds the field keys you defined in “Add fields”. id is the identifier Re:Earth CMS assigns to each item automatically. In CSV, a Geometry Editor field isn’t delivered, so the Location field doesn’t appear.
Row 2 and below hold the three items you registered in “Create items” and published in “Publish items”. The National Museum of Nature and Science item is still Draft, so it isn’t delivered.
Using the Public API endpoint this way, the field keys you defined on the Facility model, and the items you published, are delivered in a structure your spreadsheet software can work with.
Build a chart in the spreadsheet
Section titled “Build a chart in the spreadsheet”You can reuse the Re:Earth CMS data delivered through the API inside the tool that received it. From the visitors column in the table, build a chart that compares the visitor numbers per facility.
- Select
B1toB4inname. - Holding the Ctrl key, select
D1toD4invisitors. - On the Insert tab, click Insert Column or Bar Chart, then Clustered Column.
The values you entered in Visitors in “Create items” appear as a column chart per facility name.
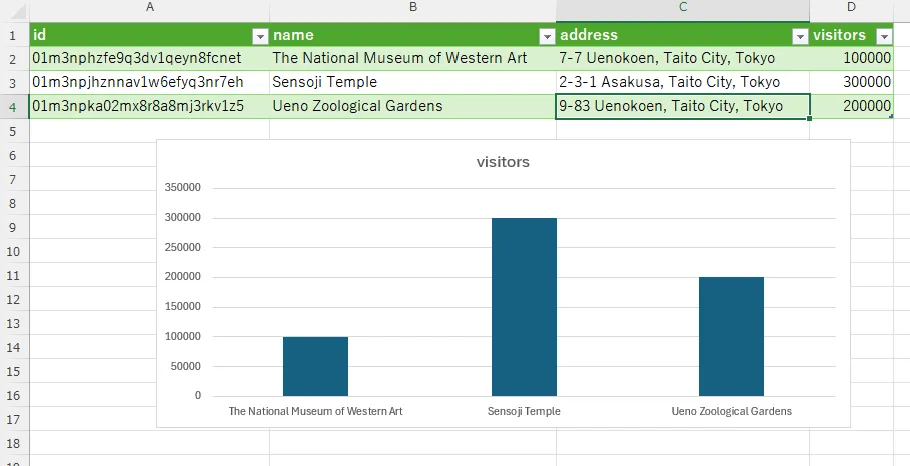
This chart is built from the visitors column that was delivered. The chart type, and which columns to use for the axis and the bars, were all specified on the Excel side in steps 1 to 3.
Re:Earth CMS holds no chart settings at all. Which fields to use and what to build from them is decided at the destination.
In the next steps, you’ll work on the Re:Earth Visualizer screen.
Display the data on a map in Re:Earth Visualizer
Section titled “Display the data on a map in Re:Earth Visualizer”Enter the same endpoint URL you imported into Excel into Re:Earth Visualizer, and display the facilities on a map.
First, create a project in Re:Earth Visualizer.
- On the dashboard of Re:Earth Visualizer, click + New Project.
- In Project Name, enter
Tourist Spots Map. - In Project Alias, enter
tourist-spots-map. - Under Project Visibility, choose Public. Depending on your plan, you can also choose Private.
- Description is optional. Leave it empty and move on.
- Under Choose a license, choose Creative Commons Attribution 4.0 International.
- Click Apply.
- Double-click the card of the project added to the dashboard.
Add the Re:Earth CMS data to the project you created as a layer.
- In the left panel, click + New Layer.
- Choose Add from URL.
- In URL, enter the URL you copied in step 3 of “Get the endpoint”.
- At the end of the URL you entered, add
.geojson. - Once the format is detected as GeoJSON, click Add.
- On the layer added to the layer list, click Fly to.
The map moves to the area around the facilities, and the three items you published in “Publish items” appear as pins. Because you added .geojson to the end of the URL in step 4 of adding the layer, the data is delivered in GeoJSON, the format a map works with.
The Location coordinates, which didn’t appear as a column in “Display the data in a spreadsheet”, are delivered in GeoJSON. The position of each pin is the coordinates of the point you placed on the map in step 3 of “Create items”.
When you change the end of the endpoint, the data you received as a table in the spreadsheet is handled as geospatial data in Re:Earth Visualizer. One pin on the map corresponds to one item.
In GeoJSON too, the Name, Address, and Visitors fields are delivered besides the Location field. Use the Re:Earth Visualizer infobox to confirm that the values of these three fields are delivered.
- Click any of the facilities shown on the map.
- On the Inspector panel, open the Infobox tab.
- Turn on the Enable switch.
The infobox appears. Inside it, you add one block per field.
- Add a block for the
Namefield.- Click the + at the top left of the infobox and choose Text.
- Click the block you added.
- Click the pencil icon shown at the top right of the block.
- Click the at the right of the Content field, and choose
namefrom the list. - Click [→.
- Add a block for the
Addressfield.- Click the + and choose Text.
- Click the block you added.
- Click the pencil icon shown at the top right of the block.
- Click the at the right of the Content field, and choose
addressfrom the list. - Click [→.
- Add a block for the
Visitorsfield.- Click the + and choose Text.
- Click the block you added.
- Click the pencil icon shown at the top right of the block.
- Click the at the right of the Content field, and choose
visitorsfrom the list. - Click [→.
When you click a facility on the map, the infobox shows that item’s Name, Address, and Visitors values. Click the three pins in turn and confirm that each facility’s values are shown.
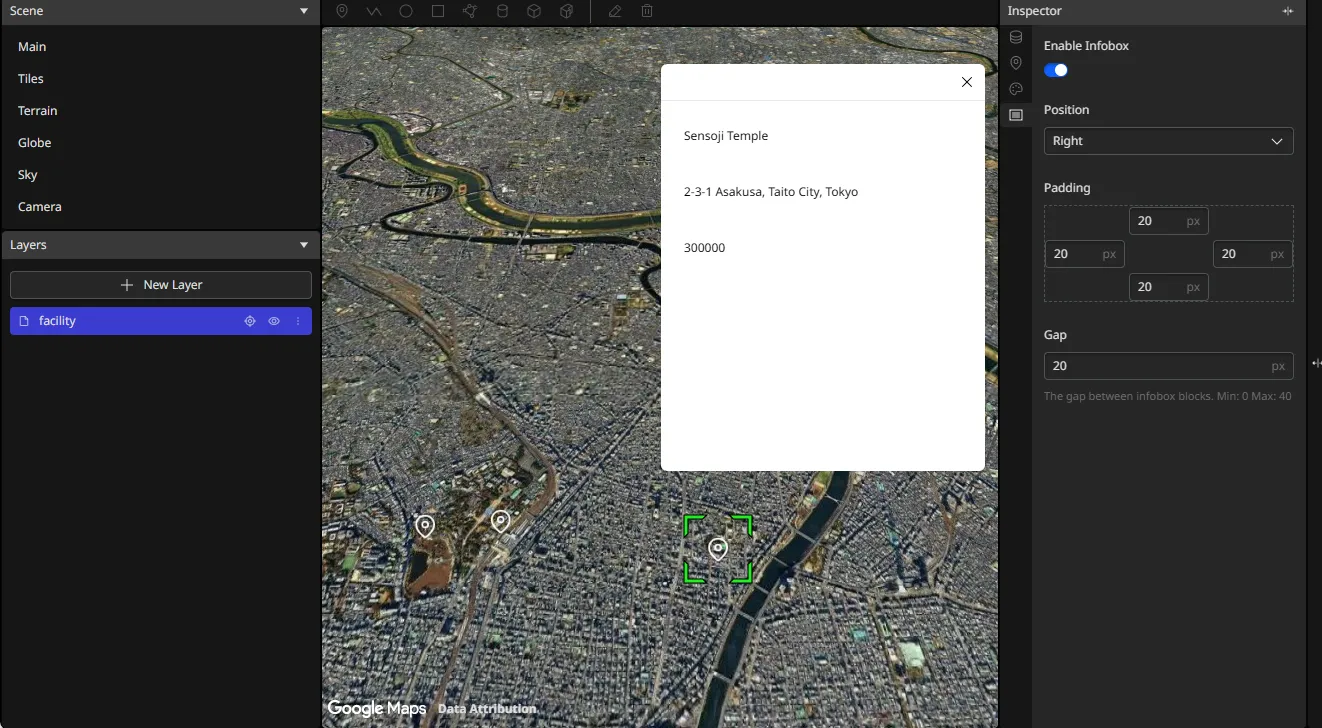
The name, address, and visitors listed under while you added the blocks are the same as the column headings in row 1 in “Display the data in a spreadsheet”.
The visitors you used in “Build a chart in the spreadsheet” as a column for comparing facilities is shown here as a value for one item at a time.
Deliver the unpublished item
Section titled “Deliver the unpublished item”National Museum of Nature and Science, which you didn’t check in “Publish items”, is still Draft. Publish it and confirm that both destinations change.
First, go back to Re:Earth CMS.
- Under Models on Content, choose
Facility. - Select the checkbox on the
National Museum of Nature and Sciencerow. - Click Publish.
- In the Publish items confirmation, click Yes.
The status of National Museum of Nature and Science becomes Published, and Public API now delivers four items.
Next, confirm in Excel how the delivered data has changed.
- Click a cell inside the table.
- On the Table Design tab, click Refresh.
Google Sheets has no button equivalent to Refresh. If you’re working in Google Sheets, instead of steps 1 and 2, copy the formula in cell A1 from the formula bar, clear the cell, and paste it back. Entering the formula again refreshes the table.
The National Museum of Nature and Science row is added to the table. To add it to the chart as well, widen B1:B4 and D1:D4, which you selected in steps 1 and 2 of “Build a chart in the spreadsheet”, to B1:B5 and D1:D5.
Next, confirm in Re:Earth Visualizer how the delivered data has changed.
- Open the Re:Earth Visualizer project you used in “Display the data on a map in Re:Earth Visualizer” and reload the browser.
- If the camera has gone back to its default position (above North America), click the layer’s Fly to button to move the camera to that layer.
You can see that the map now has four pins.
Looking back
Section titled “Looking back”The values shown in the spreadsheet and on the map are the values of the fields the Facility model’s schema defines. What you did in Re:Earth CMS goes as far as deciding the structure in “Add fields”, entering values along that structure in “Create items”, and making them subject to delivery in “Publish items”.
Excel and Re:Earth Visualizer are its destinations. Both received data from the same single endpoint, each in the format (the extension) that suits it.
What to build from the data you received was decided on the destination’s screen. In Excel you chose name and visitors and made a column chart; in Re:Earth Visualizer you visualized the data by adding an infobox of Name, Address, and Visitors to the pins drawn on the map from Location.
This is how you operate a Re:Earth CMS model as a database. Your destinations aren’t limited to the two used here: with the endpoint URL alone, another service or a frontend you build yourself can work with the same data in the same structure.
Check what you’ve done
Section titled “Check what you’ve done”Based on what you’ve done so far, think about these four.
- When you want to use data with coordinates that you manage in Re:Earth CMS in a map application, in which format should you get the endpoint URL from Public API?
- When you want to change the font size of the Re:Earth Visualizer infobox, which do you edit, Re:Earth Visualizer or Re:Earth CMS? And when you want to change the facility name and the address shown in the infobox, which do you edit?
- If you were to use Re:Earth CMS yourself, what would you want to use it for? For that purpose, what fields would the model need?
- For the model you considered in 3, which format of Public API endpoint would you use, and in what frontend could you use its data?